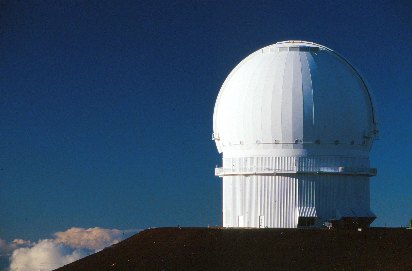
 CFHT dome on Mauna Kea, on the Big Island of Hawaii
Statistical surveys of hundreds to thousands of galaxies at moderate redshifts are essential for reliable estimates of cosmological and galaxy evolution parameters. However, even with the largest apertures, these galaxies and faint enough to require significant amounts of time to observe. Multi-object spectrographs (MOS) allow observations of many galaxies simultaneously, enabling large surveys.
CFHT dome on Mauna Kea, on the Big Island of Hawaii
We use the CFHT MOS imaging spectrograph in a particularly
efficient way, gathering spectra of a hundred galaxies to R=23 at a time,
based on a real-time aperture mask designing process. The trick is to use
a 1200A band-limiting filter for low resolution spectroscopic observations.
This makes each spectrum about 1/3 the size of the CCD detector, and allows
a 3-fold tiering of spectra. We lose wavelength coverage, but design our
filters to include the most valuable diagnostic region of galaxy spectra,
near 4000 A, including the [OII] emission line, HK spectral break, and
the CN, H-delta, H-gamma and G-band absorption lines. These lines are sufficient
to provide accurate galaxy velocities, and estimates of star formation
rates and past star formation history.
The multi-color imaging data is an essential part of the CNOC observational technique. Not only does it provide the initial catalog for design of the spectroscopic observations, but it also provides a powerful empirical measure of our selection effects and completeness as a function of galaxy magnitude, color and position in the field. These selection effects are mostly overlooked by surveys which do not include a serious photometric analysis in parallel to spectoscopy. The imaging data also provide total galaxy light measurements, luminosity functions and photometric redshift estimates.Subsection of a spectroscopic observation. Each vertical slice is a separate aperture. The thin vertical streaks in each aperture are the galaxy spectra and the horizontal lines mark the positions of bright night sky emission lines.
How we do it:
(for a more detailed technical description, please see
Yee et al. 1998, ApJS 102, 269; or click here
to get a Postscript copy of the paper)
We arrive at the telescope with the coordinates of the fields we wish to observe. On the first night, we take a direct image of the field in 2 or more filters.
 A
small subsection of the central CCD image of the cluster Abell 2390 at
z=0.23
A
small subsection of the central CCD image of the cluster Abell 2390 at
z=0.23
Each frame is reduced, and an automated procedure (PPP,
written by H. Yee) is used to find all objects in the field, and automatically
classify stars from galaxies- no mean feat with an imaging spectrograph,
where the image quality can vary greatly across the field. Multi-color,
calibrated photometry is performed on all objects and a catalog of galaxies
brighter than R=24 is created. Meanwhile, we keep observing other
fields. An aperture mask is designed from a priority list of objects based
on magnitude, color, and position.
Howard Yee designing MOS masks at 14,000 feet
The mask is fabricated real-time at the telescope
using a laser. Approximately 2-3 hours after the first image was
taken, the optimized aperture mask is ready to be inserted into the spectrograph
focal plane for long (1-3 hour) low-resolution spectroscopic exposures.
Our nights are usually scheduled in advance to the minute, and we strive
for the most efficient use of telescope time possible. Click
here
for some pictures from our last run.
Back home, the imaging data are used to create final multi-color catalogs across many individual CCD fields. Spectroscopic observations are reduced and cross-correlation techniques are used to determine redshift and spectral type identifications. Further analysis yields line spectreal line indices for a more detailed look at the star formation histories in the galaxies. You can find out more about some of our reductions software here.
1)  2)
2) 
3)  4)
4) 
Examples of our results: 1) Sample spectra and cross- correlation functions, 2) success rate as a function of magnitude, 3) a ``pie" diagram showing the distribution of galaxy redshifts and 4) a g-r vs. r color magnitude diagram, all from the Abell 2390 cluster field at z=0.23. Click on the images to see legible, full-resolution versions.
Our two surveys have been great
successes. The CNOC-1 cluster
survey obtained 1200 cluster and 1400 field galaxy redshifts in 21 clear
nights, and the CNOC-2 field galaxy
survey obtained about 6200 redshifts in 32 clear nights.
You can read about the discovery of a handful of gravitational lenses in CNOC2
at starstuff.org!